Features - Comprehensive Uptime & Performance Monitoring
Zero-downtime reliability for modern cloud apps
Start Free Trial Watch Demo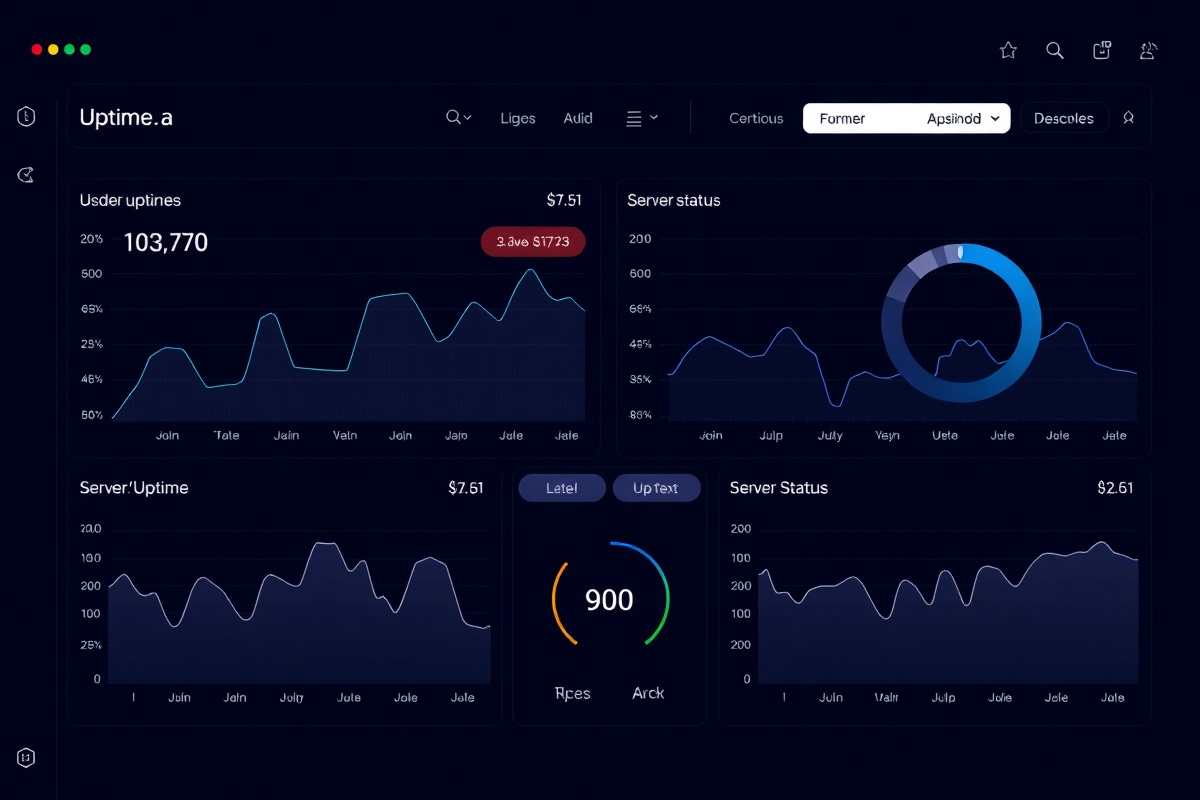
Platform Overview
Engineered for 99.999% Visibility
StatusPulse tracks every millisecond of your infrastructure from over 42 global check nodes. We combine synthetic transaction monitoring with real-user telemetry to give engineering teams a single source of truth for service health.
Our platform ingests over 1.2 billion health checks monthly, processing latency spikes, certificate expirations, and endpoint failures before they impact your customers. Built for DevOps teams managing Kubernetes clusters, serverless functions, and legacy monoliths alike.
Core Capabilities
Multi-Protocol Health Tracking
HTTP/HTTPS Endpoint Monitoring
Validate response codes, SSL handshakes, and page load times. Set custom regex assertions for JSON payloads and track API versioning across staging and production environments.
TCP Port Verification
Monitor database listeners, message queues, and custom application ports. Detect connection timeouts and TLS negotiation failures with sub-second precision.
SSL Certificate Lifecycle Management
Automated tracking of certificate chains, remaining validity, and compliance standards. Receive warnings 30, 15, and 7 days before expiration to prevent trust errors.
ICMP Ping & DNS Resolution
Track server reachability and DNS propagation delays. Correlate network hops with geographic latency to isolate ISP routing issues from host failures.
Incident Response
Granular Alerting & Root-Cause Analysis
Never waste time on false positives. StatusPulse routes notifications through PagerDuty, Slack, SMS, and webhook integrations with intelligent deduplication and escalation policies.
Our automated root-cause analysis engine correlates infrastructure metrics with application logs, instantly identifying whether a 5xx error stems from a database deadlock, a CDN cache miss, or a misconfigured load balancer. Reduce MTTR by up to 68% with actionable incident reports delivered directly to your war room.
Compliance & Analytics
Automated Uptime Reporting
Generate SLA-compliant availability reports for stakeholders, auditors, and enterprise clients with a single click.
Export monthly PDFs or schedule automated CSV dumps detailing downtime windows, recovery times, and geographic performance variances. Integrate with ServiceNow and Jira Service Management to auto-close resolved tickets and maintain audit trails for SOC 2 and ISO 27001 compliance.
Configure Your First Monitor View Sample Reports